Ask a simple question about your own country’s web. How fast is it? Who hosts it? What does it run on? Can the AI assistants your customers now ask actually read it? For Latvia, Estonia and Lithuania, nobody could answer. Global statistics lump the Baltics into “Europe”, market-share trackers only see the biggest sites, and the national registries count domains, not websites. There was no map.
So we made one. This report measures the Baltic web the way you would audit a single website, but for three countries at once: every domain, checked the same way, in the same window. Some of what we found confirms what everyone suspected. A surprising amount does not.
Over July and August 2026 we measured 293,806 websites: nearly every .lv, .ee and .lt domain that anyone, anywhere, has linked to in the past year. We checked each site the way a visitor’s browser would, and we also read the technical records every website publishes about itself: its address records, its security certificate, its rules for crawlers, its speed on a phone. Every site was checked the same way, from the same place, by a crawler that said honestly who it was. As far as we know, nobody has ever published numbers like these for the Baltics.
We did not take a sample and scale it up. We visited the domains one by one: 69,143 of the 71,251 Latvian domains on our list, 95,680 of 101,728 Estonian, 128,983 of 133,893 Lithuanian, which is 88 to 96% of every domain that appears in Common Crawl’s public index of the web. When we say 15% of Latvian sites block an AI training crawler, that is a count, not an estimate.
One note on reading the figures. Each number says what it was counted out of, because not every check reaches every site: a question about a domain’s records can be answered for all of them, while a measurement that needs a working website only covers the sites a browser can actually reach. And whenever we say a technology was detected on some number of sites, the real number can only be higher, because a tool that leaves no visible trace on the page goes uncounted.
Two webs: the registered and the living
Every country in this study has two webs. One is the web of the registries: the domains that exist on paper, are paid for annually, and get quoted in market-size decks. The other is the web a person can actually open. The gap between them has, to our knowledge, never been published for these countries, so here it is.
Start with the registries’ own figures. The Lithuanian registry’s chart data export showed 259,659 registered .lt domains in late August 2026. The Estonian registry reported 199,647 .ee domains at the end of June and announced passing the 200,000 milestone in early July. Latvia’s NIC.LV publishes a statistics chart rather than a numeric figure; read from that chart, .lv stood at roughly 157,000 in August 2026.
Now follow those numbers down to what actually works. Of roughly 157,000 registered .lv domains, only 71,251 appear anywhere in a full year of Common Crawl’s index, and only 49,258 answer as living websites. Of roughly 200,000 .ee domains, 101,728 appear in the index and 76,100 live. Of 259,659 .lt domains, 133,893 appear and 95,014 live.
About a third of registered Baltic domains, 31 to 38% depending on the country, is a website a person can open.
The rest is registered and either invisible or dead: parked, reserved, held for email, hoarded, or simply forgotten while the annual invoice keeps getting paid. In Estonia the largest share of registered domains leads to a living site (roughly 38%), Lithuania is close behind (roughly 37%), Latvia lowest (roughly 31%).
One honest caveat. Our list of domains comes from Common Crawl, so a living site missing from it is possible in principle. But a site absent from a full year of that index is a site nobody on the public web linked to in a year, which is its own kind of finding. The living counts can only be undercounts, and only slightly.
Every statistic in the rest of this report is counted against the living web, or an even stricter slice of it, never against the registered totals. When a market-size claim quotes a registry total, it is counting roughly two invisible domains for every visible website.
Three in ten Baltic domains are dead
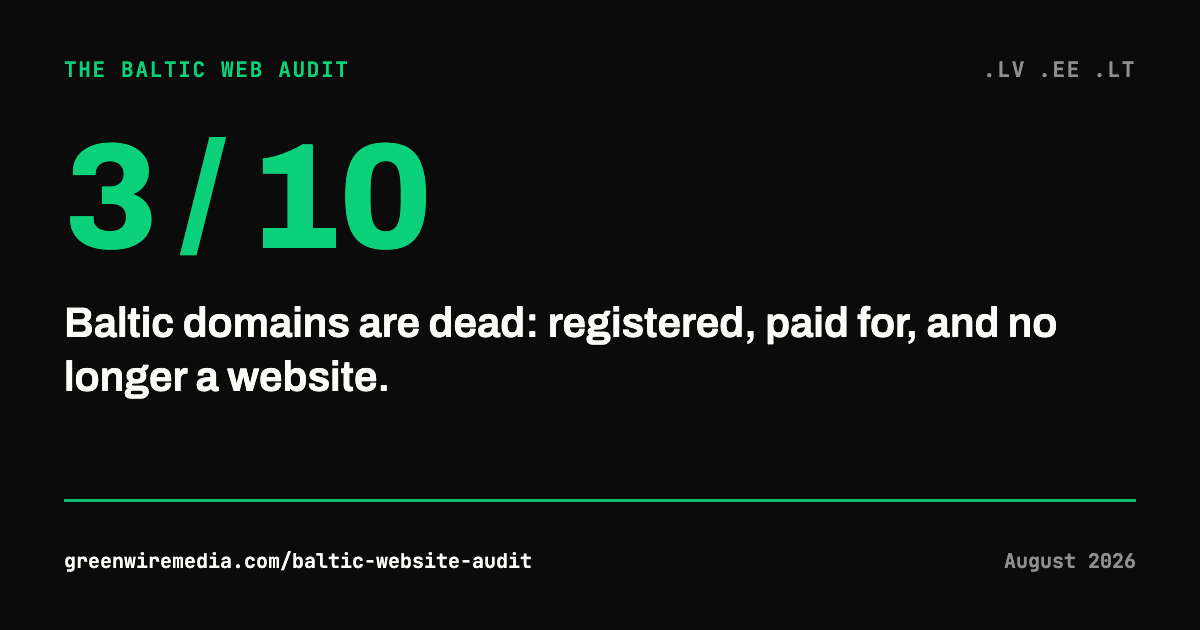
Of the 306,864 domains measured, roughly three in ten no longer respond as websites at all: 31% of .lv domains are dead, 29% of .lt, 25% of .ee. That is the death rate among the domains on our list, domains that at some point were linked to; measured against the registries’ totals, as the previous section shows, the picture is starker still.
Dead has a precise meaning in this study. A dead domain no longer points anywhere, or parks at a registrar’s placeholder page, or answers only errors when a browser knocks. It is not a slow site, not an ugly site, not a site behind a login. It is a domain someone once registered, and possibly still pays for, behind which no website exists any more. In absolute terms that is 21,985 dead .lv domains, 25,628 dead .ee domains and 38,879 dead .lt domains.
Between the living and the dead there is a third state: alive only as a pointer. Of the sites where we could see where the browser ends up, 8.8% of Latvian, 10.8% of Estonian and 6.0% of Lithuanian homepages redirect to a different site entirely (LV 3,375, EE 6,896, LT 4,485). An old brand forwarding to a new one, a national domain forwarding to a .com, a project forwarding to its parent. These domains work, in the sense that a browser ends up somewhere, but no website of their own exists behind them. The audit can even count the middle case: 1,471 Latvian, 1,717 Estonian and 1,072 Lithuanian national domains forward to the same brand on another TLD, a company holding its national domain purely as a signpost to its .com or .eu. Estonia, whose web has the fewest outright dead domains, has the most of these live forwarders; some of what looks like Estonian digital tidiness is consolidation.
What remains, a site a person can actually open, is the living Baltic web: 49,258 sites in Latvia, 76,100 in Estonia, 95,014 in Lithuania, about 220,000 sites across all three countries. Every figure in the rest of this report is counted out of what actually answers, not out of what is merely registered.
The funnel from registered to living, what a dead domain looks like from the outside, and how to tell whether yours is heading that way, is in three in ten Baltic domains are dead.
Who gets to read the Baltic web
The sharpest measurement in the study is the simplest: we asked every site, in effect, whether an AI is allowed to read it, and watched what the server actually did. We start from the sites that answered our normal browser request: 38,580 in Latvia, 64,075 in Estonia, 74,728 in Lithuania. Each of those servers then got the same request identifying itself as an AI assistant’s crawler (the kind that fetches a page so an answer engine can cite it), then as an AI training crawler, then as a plain research bot.
A robots.txt file, the note a site posts asking crawlers how to behave, tells you what a site asks. This measures what its server does.
- AI search crawlers are blocked by 7% of Latvian sites, 5% of Lithuanian, and 3% of Estonian. These sites have, knowingly or not, opted out of being cited by AI assistants: invisible in the answers their customers are increasingly reading instead of search results.
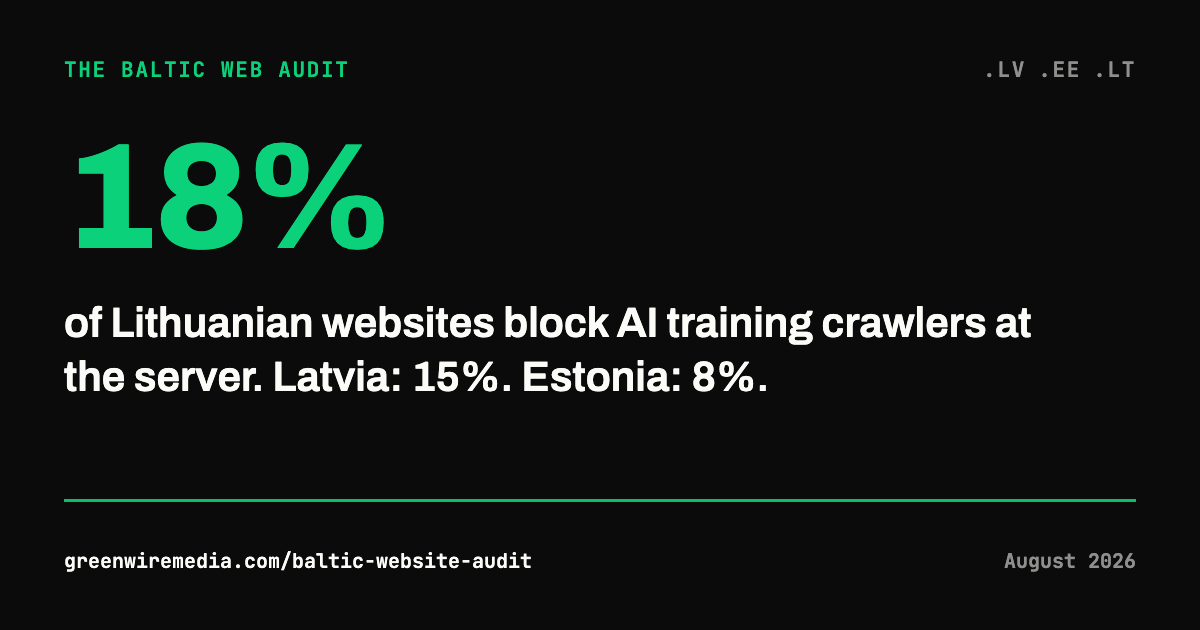
- AI training crawlers are blocked far more: 15% in Latvia, 18% in Lithuania, 8% in Estonia. The Baltic web distinguishes between being read and being learned from, and it dislikes the second much more.
- The plain research bot was blocked by under half a percent everywhere: 166 sites in Latvia, 68 in Estonia, 81 in Lithuania. The blocks are aimed specifically at AI, not at automation.
Much of this is probably not a decision anyone at these companies made. Blocking AI crawlers ships as a default in CDN and security products. Cloudflare alone was detected on 12,950 sites in Latvia, 12,220 in Estonia and 17,769 in Lithuania in this study, so a café that has never heard of crawler policy can be invisible to the assistant its customers ask for “best café near me”.
The asked-for policy layer is thinner than the enforced one. A robots.txt file exists at all on 61.8% of live Latvian sites, 60.1% of Estonian and 68.1% of Lithuanian. (Many servers answer “found” even for pages that do not exist, so we tested every site for that trick and did not count the fakes.) Of the sites that have one, rules naming an AI crawler appear on 9.5% in Latvia, 5.6% in Estonia and 6.0% in Lithuania (LV 2,878, EE 2,555, LT 3,867). So even among the minority of sites that maintain a robots.txt, more than nine in ten have never written a line about AI crawlers. The server-level blocking measured above is mostly not policy; it is defaults.
Declared policy tells the other half of the story. In robots.txt, the stated intent rather than the server’s behaviour, one sector stands alone: media. 21% of Latvian publishers declare an AI-search block, against 9% in Estonia, 11% in Lithuania, and 1 to 12% for every other sector. Publishers understand exactly what an answer engine does to a page view. Everyone else is mostly carrying a default they never chose.
How to tell whether your own site is one of them, and what to do about it, is in is your website blocking AI assistants without knowing it.
The six-second web
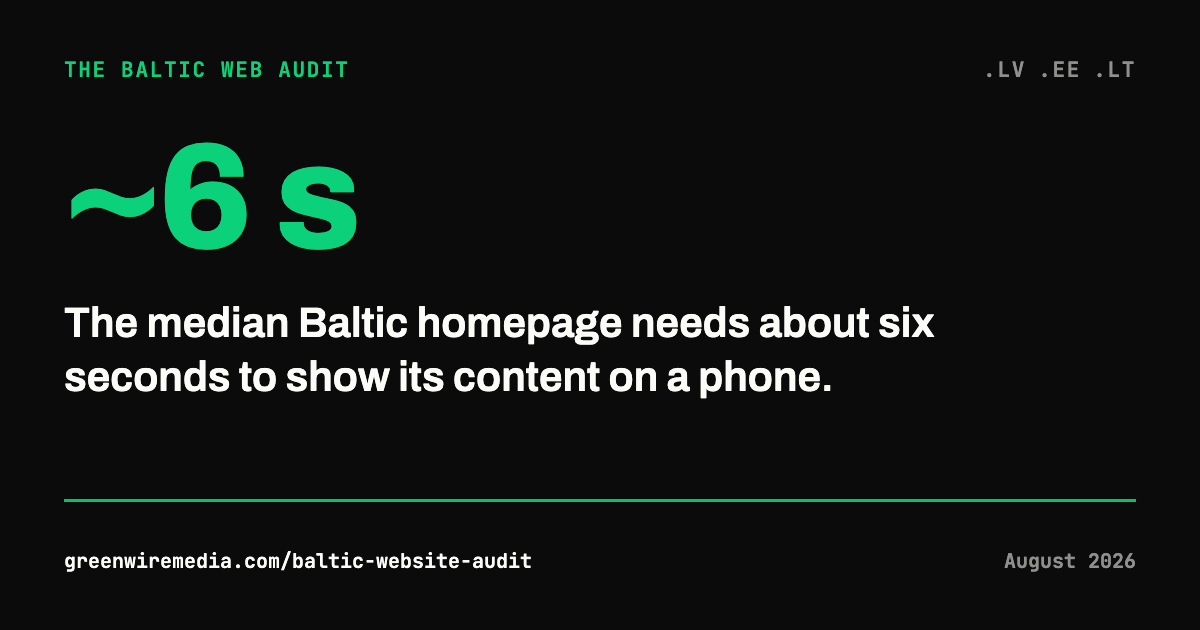
The median Baltic homepage takes about six seconds to show its main content on a phone: 6.6s in Latvia, 6.3s in Lithuania, 5.7s in Estonia.
Google times exactly this on every page, calls the measurement LCP, and feeds it into search ranking; its bar for a good mobile experience is under 2.5 seconds, and four seconds or worse counts as “poor”. Fewer than one site in five clears the “good” bar in Latvia and Lithuania (15% and 18%); Estonia does modestly better at 22%. Two-thirds or more of each country’s sites (71% in Latvia, 68% in Lithuania, 63% in Estonia) sit in the “poor” band. These are not figures from a handful of test sites: they rest on 44,279 PageSpeed measurements in Latvia, 69,021 in Estonia, 80,917 in Lithuania.
The same sites are fine on desktop. On the sites we measured both ways, 6,600 to 8,000 per country, the average desktop performance score is 86.2 in Latvia, 88.4 in Estonia and 85.7 in Lithuania, while the same sites score 69.9, 73.5 and 70.3 on mobile: a fifteen to sixteen point gap in every country. The Baltic web is built on office monitors and browsed on phones. The problem shows up in layout too: 21% of Latvian sites, 16% of Lithuanian and 14% of Estonian are wider than a standard phone screen (375 pixels), so the page hangs off the edge and the visitor scrolls sideways.
Here is the twist that saves the region from a failing report card: the slowness is the only failing grade. The median mobile CLS, the score for layout jumping around while you read, is approximately zero in every country: Baltic pages do not shift under your finger. The average best-practices score is 87.9 in Latvia, 89.6 in Estonia and 88.3 in Lithuania. And the same PageSpeed run scores accessibility and technical SEO, where the region is both better and remarkably uniform: average mobile accessibility scores of 83.3 (Latvia), 84.0 (Estonia) and 84.1 (Lithuania), and average SEO scores of 90.1, 90.0 and 90.7. The Baltic web is stable, standards-clean, broadly crawlable and passably accessible. It is just slow, and slow specifically where its visitors are: on phones.
Why sites end up at six seconds, what an owner can fix alone and where it takes a developer, is in the six-second web: how slow Baltic websites really are on a phone.
What it runs on
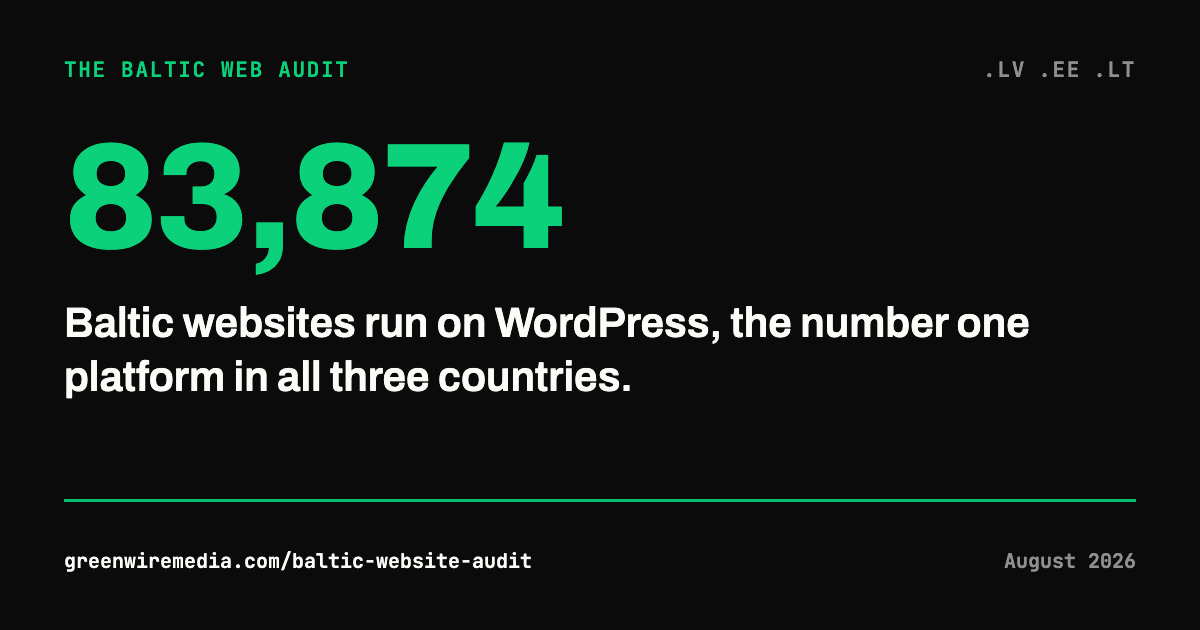
Among sites with a detectable platform, WordPress is the Baltic web’s operating system: first in all three countries, detected on 13,048 Latvian sites, 33,398 Estonian and 37,428 Lithuanian, roughly a third to a half of live sites with a detected platform. Nothing else comes close, but the runners-up say something about each country.
- Wix is the second platform in Latvia (1,919 sites) and appears on about 4,800 sites across the region (LV 1,919, EE 1,262, LT 1,632).
- Shopify is the number two platform in Lithuania, detected on 1,761 Lithuanian sites against 906 in Latvia and 640 in Estonia. Lithuania is the region’s Shopify country.
- Next.js is the number three platform in both Latvia and Estonia (1,138 and 1,180 sites, with 1,104 in Lithuania). A modern JavaScript framework outranking every legacy CMS except WordPress is a genuinely new result; five years ago this slot belonged to a PHP CMS.
- Joomla refuses to die: 917 sites in Latvia, 780 in Estonia and 1,382 in Lithuania, about 3,000 across the Baltics, still ahead of Drupal in Latvia and Lithuania. What Joomla's support dates mean for them, and how to leave well, is in the Joomla piece.
- The e-commerce open-source pair, OpenCart and PrestaShop, is a Lithuanian phenomenon: together they were detected on 2,618 Lithuanian sites (1,288 and 1,330), against far fewer in Latvia (665 and 284) and Estonia (241 and 371). Add Shopify and Lithuania’s store-platform layer is the region’s thickest.
- The long tail is real but thin: Drupal (LV 608, EE 929, LT 476), Nuxt (LV 222, EE 256, LT 175), Magento (LV 97, EE 263, LT 143), Astro (LV 152, EE 228, LT 231), Squarespace (LV 189, EE 351, LT 152), TYPO3 (121 in .lv).
One layer sits above the platform ranking: whether a site runs a recognisable platform at all. Of reachable sites (LV 38,565, EE 64,075, LT 74,728), a known platform was identified on 54.9% in Latvia (21,190), 63.4% in Estonia (40,595) and 63.7% in Lithuania (47,569). Custom-built sites we could not identify, sites that resemble each other in structure but match no known platform’s signature, account for another 38.4% in Latvia (14,813), 23.9% in Estonia (15,319) and 29.4% in Lithuania (21,974). And hand-built static sites, with no CMS and no framework detected at all, are 6.6% of the reachable Latvian web (2,562), 12.7% of the Estonian (8,161) and 6.9% of the Lithuanian (5,185). Estonia’s hand-coded web is double its neighbours’: the country with the region’s most modern platform mix is also the one where the most sites are still written by hand.
jQuery remains the single most-detected technology in every country. The Baltic web’s newest layer is React and its frameworks; its foundation is still a library first released in 2006.
The WordPress economy
WordPress at this scale is not one platform, it is an economy, and the audit can see inside it. Out of 13,048 WordPress sites in Latvia, 33,398 in Estonia and 37,428 in Lithuania, a dozen plugins recur so consistently that they amount to a regional standard build. A plugin is only counted when it leaves a visible trace on the page, so every figure here is a minimum; the real numbers can only be higher.
- Yoast SEO is the closest thing to universal: detected on 4,011 sites in Latvia, 13,016 in Estonia and 13,516 in Lithuania, which is 31% of Latvian WordPress sites, 39% of Estonian and 36% of Lithuanian. Its main rival, All in One SEO, trails at LV 1,151, EE 2,658, LT 2,891.
- Contact Form 7 (LV 3,628, EE 10,419, LT 12,460) and Elementor (LV 3,229, EE 10,040, LT 11,962) fill out the default toolkit: a form plugin from 2007 and a page builder, both on roughly a quarter to a third of WordPress sites.
- WooCommerce is the region’s real e-commerce platform. Detected on 2,253 Latvian, 7,751 Estonian and 8,584 Lithuanian WordPress sites, 17% of WordPress sites in Latvia and 23% in both Estonia and Lithuania. That makes WooCommerce alone larger than Shopify, OpenCart and PrestaShop combined in every country.
- The multilingual layer splits on a line you can almost draw on a map. WPML, the paid incumbent, dominates in Estonia (5,363 detections) and Latvia (1,919); in Lithuania it was detected on 2,668 sites while the free Polylang holds 1,710, a far stronger relative showing than Polylang’s 1,008 in Latvia or 1,783 in Estonia against WPML’s much larger Estonian base. Three officially monolingual countries run a heavily multilingual web, and they pay for it differently.
- Slider Revolution persists on 1,338 Latvian, 3,147 Estonian and 5,241 Lithuanian sites: the homepage slider, a design pattern the industry declared dead a decade ago, is alive on thousands of Baltic sites, and most alive in Lithuania.
- WP Rocket (LV 645, EE 2,508, LT 1,830) and MonsterInsights (LV 347, EE 1,290, LT 1,300) round out the recognisable stack.
- And underneath nearly all of it, jQuery Migrate, a compatibility layer that exists to keep decade-old JavaScript running, rides on 9,309 Latvian, 25,755 Estonian and 27,384 Lithuanian WordPress sites: the large majority of the WordPress web in every country carries code whose whole job is backwards compatibility.
The finding is not that the Baltic web runs on WordPress. Everyone assumed that, and the data confirms it. The finding is that it runs on a recognisable stack of about a dozen plugins, repeated tens of thousands of times: Yoast, Contact Form 7, Elementor, WooCommerce, a slider, a multilingual plugin, a cache. When one of those ships a vulnerability or a breaking change, it is not one site’s problem; it is a measurable slice of three national webs.
The vibe-coded Baltics
For the first time, AI-generated and no-code sites are measurable in production, and the Baltics have some.
Lovable, the AI site builder, was detected on 311 Baltic production sites: 69 in Latvia, 150 in Estonia, 92 in Lithuania.
Estonia leads in absolute count despite having a smaller web than Lithuania, which fits its reputation more neatly than almost any other number in this study. These are not demos or test deployments; they are live sites on national domains, built substantially by a model. Alongside them sit the design-tool exporters: Framer on 65 Latvian, 116 Estonian and 117 Lithuanian sites, and Webflow on 48, 20 and 24 in the same order.
The no-code layer has an older, distinctly local story too. Tilda is a Latvian favourite: 574 Latvian sites, making it the 8th-largest platform in .lv, against 310 in Estonia and 109 in Lithuania. Mozello, itself a Latvian company’s builder, runs 89 sites at home against 4 in Estonia and 10 in Lithuania: a domestic product with a domestic customer base. And Estonia has its own, larger version of the same story: Voog, the Estonian website builder, serves 2,089 .ee sites by server header. Estonia’s Mozello, only bigger at home, and a first sighting of a pattern this report will keep returning to: Estonians building Estonian tools and then actually using them.
Kept in proportion: all of these together are a rounding error against WordPress, which alone was detected on 13,048 Latvian, 33,398 Estonian and 37,428 Lithuanian sites. But a rounding error that did not exist two years ago and can now be counted site by site is worth counting. Lovable’s 311 sites are the first measured baseline for AI-built production websites on these three national domains; the interesting number is what these rows look like in the 2027 run.
One company hosts a country
Ask where the Baltic web is hosted, company by company rather than country by country, and two of the three national webs turn out to have a landlord.
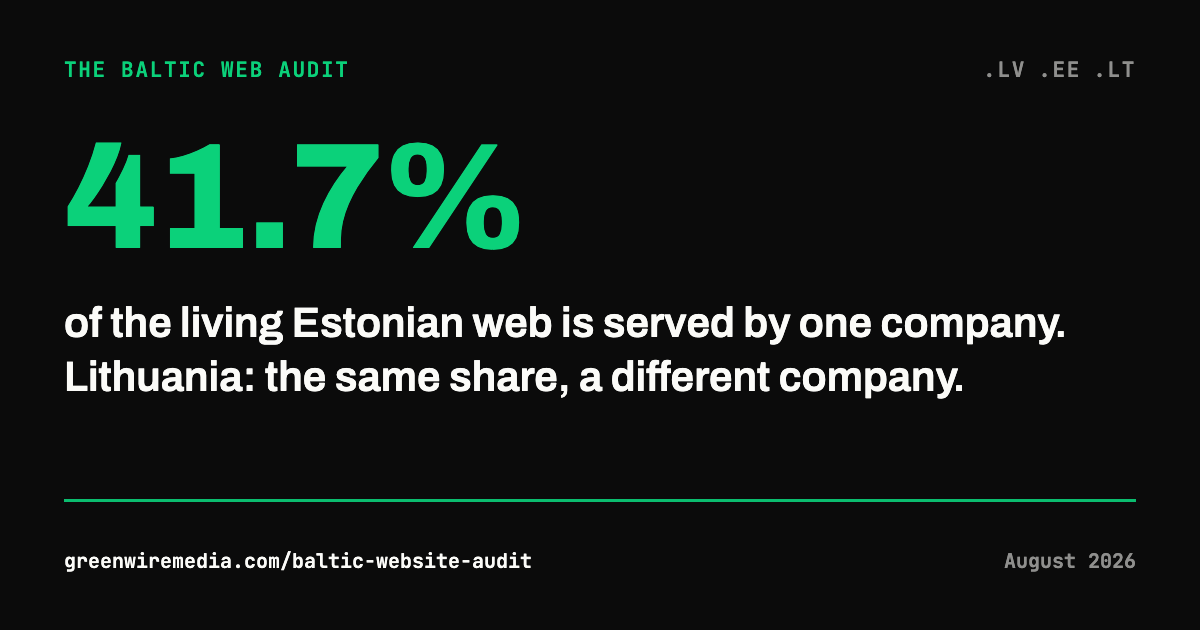
Zone Media serves 41.7% of the living Estonian web: 31,707 live .ee sites on a single Estonian company’s network.
Add Elkdata, the second Estonian host at 11,285 sites (14.8%), and two Estonian companies serve 56.5% of Estonia’s living web. The server headers say the same thing from another angle: the most common server string on .ee is Apache/ZoneOS (26,342 sites), Zone’s own stack, with plain Apache (11,953) behind it. Estonia’s DNS tells it a third time: Zone runs nameservers for 33,623 .ee domains.
Lithuania has the same shape with a different name on the door. Interneto vizija serves 39,623 live .lt sites, also exactly 41.7% of its national web, a coincidence of percentages that is almost suspicious and is nonetheless what the data says. Hostinger’s network carries another 14,502 (15.3%), Cloudflare 13,999, Telia Lietuva 4,401. The DNS layer is even more concentrated: serveriai.lt, Interneto vizija’s nameserver brand, runs DNS for 41,700 .lt domains, and dns-parking.com, Hostinger’s parking service, for another 14,544. Server software follows: Apache on 28,818 Lithuanian sites, LiteSpeed on 8,256, and hcdn, Hostinger’s CDN, on 6,670.
Latvia has no landlord. The biggest name in front of its web is Cloudflare, standing before 11,181 sites, 22.7% of the living Latvian web, and Cloudflare does not host them: it is a relay, and the real servers behind it are hidden, scattered wherever they are. The largest true domestic host is Nano IT at 3,717 sites (7.5%), then LeaseWeb in the Netherlands (3,438), DELSKA, the former DEAC (2,307), and Hetzner (2,281). No Latvian company serves even a tenth of the Latvian web. The server software splits the same way: cloudflare on 9,563 sites, nginx on roughly 7,979, Apache on 5,156, with no dominant stack. Cloudflare runs DNS for 11,915 .lv domains, 24% of the living Latvian web, against 7.6% of .ee; where Estonia delegated its DNS to Zone, Latvia delegated a quarter of its to a company in San Francisco. (Wix’s in-house server, Pepyaka, makes a cameo on 1,837 Latvian, 1,165 Estonian and 1,422 Lithuanian sites, one server name for the whole region’s Wix layer.)
This is the structural finding under the geographic one: it is not just that Estonia and Lithuania host domestically and Latvia does not. It is that Estonia and Lithuania each have a single company that grew large enough to hold two-fifths of a national web, and Latvia never did, so its web drained to wherever hosting was cheapest or most convenient, abroad or out of sight behind Cloudflare. Estonia and Lithuania have landlords; Latvia has a curtain. Concentration cuts both ways, and it is worth saying analytically rather than alarmingly: one company at 41.7% of a national web is efficient, consistent and patchable in bulk, and it is also a single point of national failure. An outage, a compromise or a business failure at one Estonian or one Lithuanian company is, on these numbers, a two-fifths outage of a country’s web. Latvia’s fragmentation, whatever it costs in sovereignty, is at least diversified.
Where it physically lives
Roll the company-level picture up to countries and one thing has to be said first, because it changes the map. A site behind a relay network like Cloudflare reports the relay’s location, not its own: its true home is hidden. So the honest question splits in two. How much of each web hides where it lives, and where are the sites we can actually place?
- Latvia is the region’s curtain country: 31.3% of the Latvian web (15,416 of 49,211 sites with a measurable location) hides its true location behind a CDN, mostly Cloudflare. That is double Estonia’s 12.2% (9,231 of 75,831) and well above Lithuania’s 18.6% (17,638 of 94,881). Nearly a third of the Latvian web does not reveal where it is actually hosted.
- Estonia hosts its own web. Of the sites whose real location is visible (66,600), 54,068 are served from Estonia itself, 81.2%, with Germany a distant second at 4,007 and the United States at 2,482.
- Lithuania mostly does too: 68.1% hosted at home (52,615 of 77,243 visible sites), then Germany at 8,534 and, unusually for the region, Ukraine at 7,295; the United States holds only 2,161.
- Latvia does not: among sites whose location is visible, only 40.8% are hosted at home (13,785 of 33,795), with the Netherlands (3,589), the United States (3,438) and Germany (3,435) each carrying a similar slice. The previous chapter explains why: with no dominant domestic host, there was nothing to keep the Latvian web at home, and much of it is now not merely abroad but unplaceable.
Lithuania carries a second, less visible layer of sovereignty. Hostinger, the hosting company founded in Lithuania, was detected as the technology behind 9,492 Lithuanian WordPress sites, with its CDN on 3,924 more. So even where a Lithuanian site is physically served from abroad, a meaningful slice of the Lithuanian web runs on Lithuanian-built infrastructure. Latvia has no equivalent; its web is either somewhere else or behind the curtain.
The certificate revolution nobody noticed
Somewhere in the last decade, the paid-for website certificate quietly lost, and nobody held a press conference. A certificate is the document behind the browser’s padlock, the thing that makes a connection count as secure. The audit made a secure connection to 42,037 Latvian sites, 72,866 Estonian and 81,521 Lithuanian, and read every certificate.
Let’s Encrypt, the authority that issues certificates free and automatically, is behind 64.4% of them in Latvia (27,067), 79.4% in Estonia (57,892) and 68.7% in Lithuania (55,993).
The Estonian figure is the regional extreme, and it is Zone again: a host that automates certificates for two-fifths of a country moves the national statistic by itself. The remaining share is mostly Google Trust Services (9,869 sites in Latvia, 23.5%; 5,677 in Estonia; 12,221 in Lithuania, 15.0%), which is what Cloudflare-fronted sites tend to carry, so Latvia’s higher Google Trust share is its Cloudflare density wearing a different hat. Sectigo, the classic paid vendor, holds LV 1,646, EE 7,281, LT 904, and an issuer named PerfectSSL accounts for 9,419 Lithuanian certificates. The encryption underneath is equally modern: the newest standard, TLS 1.3, runs on 91.3% of Latvian secure connections, 96.1% of Estonian and 92.7% of Lithuanian, with nearly all the rest on the previous version.
That is the revolution. The tails are the comedy.
- Expired certificates are still being served on 1,669 Latvian sites (4.0% of secure connections), 1,065 Estonian (1.5%) and 2,106 Lithuanian (2.6%). In the Let’s Encrypt era, an expired certificate means automation that broke and nobody noticed, which makes it a decent sign that nobody is watching the site at all.
- Self-signed certificates answer on 1,199 Latvian, 417 Estonian and 488 Lithuanian sites: the server equivalent of writing your own ID.
- The certificate does not cover the www version of the address on 8,791 Latvian sites (20.9%), 20,933 Estonian (28.7%) and 16,767 Lithuanian (20.6%). Estonia is highest, and a later chapter shows why: Estonia is the region’s bare-domain country, so its www variants are the most neglected. Either way, a fifth to a quarter of the padlocked web breaks the moment a visitor types www.
- And the study’s favourite artefact: 751 Latvian sites serve a certificate whose subject reads “Internet Widgits Pty Ltd”, the placeholder company name OpenSSL suggests when you generate a certificate and press Enter through every prompt. Seven hundred and fifty-one Latvian servers are cryptographically asserting that they belong to a fictional Australian company, because nobody ever typed a name.
Security: the padlock is there, the rest is not
Four out of five sites (79 to 81%) enforce HTTPS. The visible, browser-nagged part of security is broadly solved, and the previous chapter shows how: it was automated, mostly for free.
The invisible parts are not:
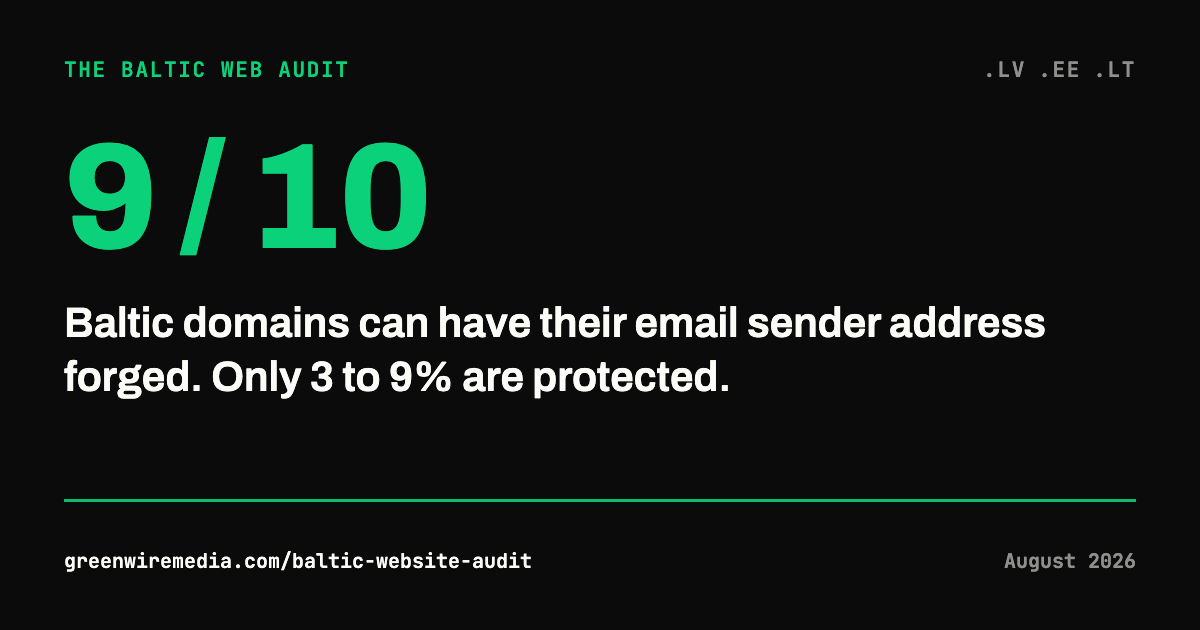
- Email spoofing protection is close to nonexistent. First, the scale of the exposure: a mail setup, meaning the domain actually receives email, is present on 77% of live Latvian domains, 83% of Estonian and 89% of Lithuanian. The Baltic web does email almost universally, which is what makes the next number bite. Two standard records, called SPF and DMARC, let a domain tell the world’s mail servers which senders are genuine and what to do with fakes. A domain is only actually protected when both are in place and enforcement is switched on, and that describes 8% of live Latvian domains, 9% of Estonian, and 3% of Lithuanian. The majority in every country (60% in Estonia, 70% in Latvia, 72% in Lithuania) has no DMARC record at all: for those domains, nothing stops a forged sender. And having the record mostly changes nothing: among domains that do publish DMARC, the policy is “none”, meaning watch but do nothing, on 53.6% in Latvia (7,740 of 14,439), 68.6% in Estonia (20,978 of 30,593) and 77.9% in Lithuania (20,573 of 26,406). A policy that rejects fakes outright stands on 3,584 Latvian, 3,343 Estonian and 2,457 Lithuanian domains; one that quarantines them on 3,115, 6,272 and 3,376 in the same order. Adoption without enforcement: the record was published, the switch was never flipped. Lithuania’s combination is the worst in the region: the most mail-enabled web, the least protected one, and the highest monitor-only share among those who tried.
- DNSSEC splits the region three ways. DNSSEC is a signature on a domain’s address records, so nobody can quietly redirect its visitors: 22% of .ee domains carry it, 12% of .lv, and 2% of .lt, a tenfold spread between neighbours facing the same threats.
- Almost nobody says who to tell when it goes wrong. security.txt, the standardised file that gives security researchers a contact address, was found on 0.8% of Latvian sites (289 of 38,520), 0.6% of Estonian (366 of 63,982) and 0.5% of Lithuanian (399 of 74,501). A researcher who finds a hole in a Baltic site has, more than 99 times out of 100, no published route to report it.
What DMARC actually does, how to read your own record in one command, and the staged way to switch enforcement on without losing real mail, is in anyone can send email as your company: the DMARC gap.
Privacy, measured rather than promised
- 65 to 76% of sites set cookies before any consent is given, Latvia worst at 76%, Lithuania at 71%, Estonia at 65%. Eight years after GDPR, the consent banner is everywhere and consent itself is mostly decorative.
- 36 to 45% load fonts from Google’s CDN, sending every visitor’s IP address to Google before the page draws, a practice a German court has already ruled violates the GDPR (LG München, 2022).
- The average homepage talks to 5 to 6 third-party hosts and makes 60 to 72 requests before a visitor does anything.
- The content behind all that machinery is often thin: 36% of Latvian homepages, 41% of Estonian and 37% of Lithuanian carry thin homepage content, a page that loads dozens of third-party resources to say almost nothing.
The first of those figures has a sharper version, and it is the chapter’s centrepiece. The audit detected a consent-management tool, software whose entire job is to gate cookies behind a visitor’s choice, on 2,886 Latvian sites, 5,932 Estonian and 7,844 Lithuanian.
Of the sites that installed one, 90% in Latvia (2,594), 91% in Estonia (5,403) and 89% in Lithuania (7,007) still set cookies before any consent is given.
The market behind the banners is consistent across the region: CookieYes leads everywhere (LV 1,399, EE 3,772, LT 4,126 sites), then Complianz (LV 472, EE 1,024, LT 1,401) and Cookiebot (LV 533, EE 629, LT 1,384), with OneTrust, Usercentrics, Osano and iubenda trailing. And among sites that set pre-consent cookies, the median number set is 4: not one stray session cookie, a handful. Put plainly, nine in ten sites that installed the tool for asking permission do not wait for the answer. The banner was installed; the behaviour never changed.
A third of the Baltic web talks to Google
Add up the Google layer, service by service, and the total is eerily consistent. At least one Google service (Analytics, Tag Manager, reCAPTCHA, the Fonts API or Maps) was detected on 15,661 live Latvian sites, 24,218 Estonian and 31,241 Lithuanian. As shares of the living web that is 31.8%, 31.8% and 32.9%: three countries with different platforms, different hosts and different languages, and in each of them almost exactly one site in three phones Google when it loads.
Google Analytics alone runs on about a fifth of each country’s living web: 10,282 sites in Latvia (20.9%), 15,213 in Estonia (20.0%), 20,339 in Lithuania (21.4%). Google Tag Manager follows on 5,276 Latvian, 8,149 Estonian and 10,530 Lithuanian sites, and reCAPTCHA on 2,720, 7,603 and 7,563 in the same order. These are detections, so the true Google surface is at least this large.
Then comes the counter-story, and it is the single clearest case in the study of a country preferring its own software.
Plausible, the privacy-focused analytics tool built in Estonia, was detected on 3,257 Estonian sites, 4.3% of the living .ee web, against 26 Latvian sites and 8 Lithuanian.
Estonia uses its own analytics at roughly 125 times its neighbours’ rate. This is not a global product with an even sprinkling of regional users; it is a national web consciously routing around Google because the alternative happens to be Estonian. Matomo, the self-hosted option, is negligible everywhere, single digits.
Lithuania has its own version of the same story, in marketing rather than analytics. Omnisend, the e-commerce marketing platform founded in Lithuania, was detected on 860 Lithuanian sites against 47 Latvian and 48 Estonian; MailerLite, also Lithuanian-founded, on 463 against 40 and 123. Each Baltic country that builds a web tool adopts its own: Estonia measures with Plausible, Lithuania mails with Omnisend and MailerLite, Latvia builds on Mozello, and each is strongest at home. One more Lithuanian distinction hides in the ad layer: Google AdSense runs on 1,803 Lithuanian sites against 678 Latvian and 660 Estonian. Lithuania’s ad-funded web is roughly three times the size of its neighbours’. The paid-service tail is thin by comparison, and worth recording as a baseline: Stripe on LV 54, EE 94, LT 126 sites, PayPal on LV 40, EE 54, LT 76, Tidio’s chat widget on LV 32, EE 63, LT 102, all detections, all small.
Two plumbing figures close the loop on earlier chapters. HTTP/3, the newest way for a browser and a server to talk, runs on 30.5% of live Latvian sites, 13.7% of Estonian and 24.8% of Lithuanian: Latvia leads because Cloudflare switches it on by default, and Estonia trails because Zone’s stack does not, a neat demonstration that a national web’s modernity is set by whoever hosts it, not by its developers. HSTS, the setting that tells browsers to never try an insecure connection again, sits at 19.7% in Latvia, 20.9% in Estonia, 14.4% in Lithuania.
llms.txt: adopted by software, not by people
llms.txt, the proposed “instructions for AI” file, turns out to be the study’s best example of why measurement beats assumption, twice over.
Counted naively, 19 to 24% of sites per country “have” llms.txt. Half of that is servers that answer “found” to any address whatsoever, and the audit measured that failure mode directly: 13.6% of probed Latvian servers (5,257), 9.7% of Estonian (6,230) and 12.1% of Lithuanian (9,024) claim to have a page that cannot exist. That is exactly why every figure of this kind in the report is tested against that trick first. Filter the fakes out, check that what comes back is really a text file, and real adoption across all measured sites is 12% in Latvia (4,484 of 38,520), 10% in Estonia (6,249 of 63,982) and 11% in Lithuania (8,374 of 74,501). Every one of those is a genuine text file, not a web page wearing a .txt name: in a 600-site spot check of what the servers actually sent, 507 came back as plain text and 93 as Markdown, with not one page in disguise.
The second finding is better: reading the actual files shows they are overwhelmingly auto-generated. All in One SEO ships one; Wix generates one that advertises the site’s MCP endpoint. Baltic site owners are not adopting llms.txt; their plugins are. What looks like a grassroots convention is a handful of software vendors’ release notes. For completeness, ai.txt, the rival proposal: 14 sites in Latvia, 30 in Estonia, 90 in Lithuania. It effectively does not exist here.
The languages of the Baltic web
Every homepage can name its main language in its code, and search engines read that label. This chapter counts those labels. It is not an analysis of the words on the page, so a site that never set the label, or set it wrong, is counted as written. The counts are out of the homepages we could read: 42,255 in Latvia, 69,791 in Estonia, 81,438 in Lithuania.
Roughly two homepages in the local language for every one in English.
The pattern is the same in all three countries. Latvia has 22,216 Latvian homepages and 11,126 English ones. Estonia has 37,216 Estonian and 20,076 English. Lithuania has 47,879 Lithuanian and 20,408 English. The national webs are national first, international a strong second, and the proportion barely moves across the border.
Russian is a far smaller presence than most public conversation would suggest: 791 homepages in Latvia name Russian as their main language, 1,001 in Estonia, 212 in Lithuania. That is under 1.5% of the homepages we could read, in every country. One caveat matters here: we counted each site’s main language only. A site that offers Russian as its second or third language, behind a language switcher, does not show up in these numbers.
The machinery for running one site in several languages is most built-out in Latvia. The markup that tells search engines “this page also exists in these other languages” appears on 28.2% of Latvian homepages, 23.0% of Estonian and 19.3% of Lithuanian. Latvia runs the most multilingual web of the three, which fits the WordPress chapter’s finding that WPML, the paid translation plugin, is proportionally strongest there. Three officially monolingual countries, and one of them keeps parallel language versions on more than a quarter of its homepages.
The basics, graded
The PageSpeed SEO averages of 90 from the speed chapter deserve an asterisk, and this chapter is the asterisk. The automated score measures whether a machine can get in: is there a title, can a search engine fetch the page, does it say it is mobile-ready. It does not measure whether anyone actually wrote anything. Read the homepages themselves (LV 42,255, EE 69,791, LT 81,438) and the craftsmanship layer looks like this:
- No meta description, the sentence a site writes for its own search result, on 44.0% of Latvian homepages, 49.9% of Estonian, 45.1% of Lithuanian. Half the Estonian web lets Google improvise its search snippet.
- No main heading (an H1) on 39.4% of Latvian homepages, 42.4% of Estonian and 39.8% of Lithuanian, and more than one on roughly 16% everywhere (LV 16.1%, EE 15.5%, LT 15.8%). Somewhere near half of Baltic homepages get the single most basic heading rule wrong in one direction or the other. Demand the full standard, headings in clean order from top to bottom, and it survives on only 28.0% in Latvia, 25.9% in Estonia and 26.0% in Lithuania: barely one in four.
- No Open Graph tags, the labels that control how a link looks when shared, on LV 50.9%, EE 46.5%, LT 47.1%: share any of those pages to a social feed and the preview is whatever the platform scrapes up.
- A canonical tag, the line that tells search engines which address is a page’s one true address, is present on LV 53.0%, EE 57.6%, LT 57.8%. A title is at least nearly universal; only LV 3.6%, EE 5.8%, LT 3.0% lack one. The titles that exist are short: a median of 32 characters in Latvia, 30 in Estonia and 37 in Lithuania, against the roughly 60 Google displays. The median Baltic homepage leaves half its search-result headline blank.
- No viewport tag, the line that tells a phone how to scale the page, on LV 14.1%, EE 12.3%, LT 11.9%: one homepage in seven in Latvia does not even declare itself mobile-aware, which connects directly to the sideways-scrolling figures in the speed chapter.
- A secure page pulling in insecure pieces, what the trade calls mixed content, on LV 22.5%, EE 23.2%, LT 24.8%: a quarter of the padlocked web undermines its own padlock.
- The bright spot is image descriptions for screen readers: on average 85.5% of images carry one in Latvia, 87.4% in Estonia and 87.0% in Lithuania, respectable by any international comparison and consistent with the solid accessibility scores.
- And the words themselves are few: the median Baltic homepage carries 330 words in Latvia, 278 in Estonia and 337 in Lithuania. The images match: a median of 11 per homepage in Latvia and Lithuania, 7 in Estonia. Estonia’s homepages have the fewest images and the fewest words, consistent with its 41% thin-content share: the region’s fastest web is also the one with the least to say per page.
Structured data, the machine-readable labels a page can carry to tell search engines what it is about, tells the same story with sharper teeth. Some of it exists on 14,375 Latvian homepages (34.0%), 30,556 Estonian (43.8%) and 33,116 Lithuanian (40.7%), which sounds respectable until you read what the labels actually say. The most common ones announce only “this is a website”, “this is an organisation”, “this is a page”: the boilerplate an SEO plugin emits on install, describing the existence of a website to a search engine that already knows. The labels that would tell a machine what the business actually is are rare. A local-business label appears on LV 1,659, EE 1,379, LT 1,713 sites, an FAQ label on LV 934, EE 826, LT 1,126, an event label on LV 47, EE 115, LT 122, and job postings are effectively zero. The starkest gap is retail.
The product label, the one that lets a shop’s goods surface as products in search results and AI answers, was detected on 177 Latvian sites, 1,280 Estonian and 449 Lithuanian, against LV 6,888, EE 8,708, LT 13,600 labelled shops. That is 2.6%, 14.7% and 3.3%: almost no Baltic shop tells search engines what it sells.
Estonia is partially excepted, in one more instance of the pattern this report keeps finding. The reconciliation with the SEO score of 90 is simple. The Baltic web passes the machine checks and skips the human ones. Its pages are crawlable, titled, viewport-declared; they are also undescribed, unstructured and unshareable-with-a-preview. The score measures whether the door is open, not whether anyone furnished the room.
How big is a Baltic website?
Because we measured everything, we can answer a question that sounds unanswerable: how big is a website here, typically? Among sites that hand search engines a sitemap, the index file listing their pages, half list 37 pages or fewer in Latvia, 35 in Estonia and 44 in Lithuania. A quarter list 10 or fewer, and one in ten lists just 2. Only about half of live sites publish a sitemap at all, and those tend to be the better-built half, so the typical Baltic website is about 40 pages, and probably smaller. Its homepage weighs about 73 KB in Latvia and Estonia and about 85 KB in Lithuania. It runs an average of 6.5 detected technologies per site in Latvia, 7.3 in Estonia and 7.6 in Lithuania, a CMS, a theme, a few plugins, an analytics tag. And before it shows anything, it redirects: on average a visitor is bounced through about two addresses before the page arrives (LV 2.19, EE 2.05, LT 2.07), and chains of three or more redirects, each one a full round trip added before any content arrives, run on 11,413 Latvian, 12,889 Estonian and 15,090 Lithuanian sites. This is not the web of case studies and conference talks.
The typical Baltic website is a forty-page brochure with a two-hop front door, and every average in this report is an average over mostly that.
The frozen web
Some fraction of every national web is still online but no longer alive in any meaningful sense: serving, renewing its certificate by cron job, and untouched by human hands for years. The audit can put numbers on the freezer.
Of sites displaying a copyright year in their footer (16,698 in Latvia, 22,790 in Estonia, 34,348 in Lithuania), the year is 2020 or older on 14.6% of Latvian sites, 8.6% of Estonian and 14.3% of Lithuanian.
One site in seven, in Latvia and Lithuania, publicly timestamps its own abandonment at half a decade or more. Estonia’s freezer is markedly smaller; 65.7% of its dated footers say 2025 or newer, against 71.2% in Latvia and 68.6% in Lithuania, so Latvia’s distribution is the most polarised: the most current footers and among the most ancient ones, with less in between.
The sitemaps agree. A sitemap exists on 45.9% of live Latvian sites, 55.4% of Estonian and 50.3% of Lithuanian, and of the sitemaps that carry dates, the newest entry is older than 2025 on 15.8% of Latvian ones, 16.5% of Estonian and 18.0% of Lithuanian: a sitemap on a live site whose most recent content is at least a year and a half old, a map of a town nobody has built anything in since.
One relic in the freezer turns out to be warmer than expected. An RSS or Atom feed is still advertised on 12,520 live Latvian sites (25.4%), 28,681 Estonian (37.7%) and 32,442 Lithuanian (34.1%). RSS never died in the Baltics, partly no doubt because the platforms ship a feed by default and nobody turns it off; either way, between a quarter and a third of the living web remains subscribable by a protocol most of the industry declared dead a decade ago.
The neglect is visible while the pages load, too. At least one JavaScript error, a script on the page failing, fires on homepage load on 26.9% of rendered Latvian sites, 28.8% of Estonian and 27.9% of Lithuanian (out of the homepages we could fully load in a browser: LV 36,838, EE 62,883, LT 73,252). More than a quarter of the living Baltic web loads with something quietly breaking, in every country, at almost exactly the same rate.
A small, opposite slice is frozen in a subtler way: too modern rather than too old. On 3.1% of rendered Latvian sites, 2.1% of Estonian and 2.0% of Lithuanian, the page a browser finally displays holds more than ten times as much as the file the server actually sent: the file is effectively empty, and JavaScript builds the page after the fact. Those sites are largely invisible to any crawler that does not run a full browser, which includes most AI crawlers. Two to three percent of the Baltic web has, without deciding to, opted out of the answer-engine era from the opposite direction as the blockers in the AI chapter: not by refusing to serve, but by serving a blank page to anything that does not run a browser.
And one quiet migration completed while nobody watched: the www prefix lost. The main address is the bare domain, without www, on 67.5% of Latvian sites where it could be determined, 81.7% of Estonian and 69.4% of Lithuanian. Estonia dropped its www hardest, which by this chapter should surprise nobody.
Records from the census
Measure nearly 300,000 websites and the extremes measure themselves. We name no names; the point is the range.
- The slowest homepage takes over 13 minutes (816 seconds) to show its main content in Google’s standardised mobile test. It has company: 6,654 sites take 30 seconds or more. At the other end, the fastest homepage manages 0.6 seconds, 18,118 sites show their content in under one second, and 22,937 sites score a perfect 100 on mobile performance. The distance between the best Baltic homepage and the worst is the distance between a blink and a lunch break.
- The busiest homepage makes 3,096 requests on a single load. Another contacts 109 different third-party services before the visitor has clicked anything. A third sets 88 cookies before anyone has consented to one.
- The longest title, the text meant for a browser tab and a search result, runs 5,913 characters. Google shows about 60.
- One homepage carries 14,860 images. Another carries 407,866 words, roughly four novels, on a single page.
- One homepage lists 4,606 alternative language versions of itself.
- One homepage fires 7,026 JavaScript errors while loading. It loads anyway, which says something about the resilience of the modern browser.
- One homepage’s raw file is nearly empty, and JavaScript then builds a page roughly 56,000 times its size. To a visitor it is a website; to anything that does not run a browser it is a blank sheet.
- The largest sitemap declares 951,539 pages, on a web where the median site has about 40.
- The oldest footer copyright still online says 1994. It is not alone: 142 sites show a 1990s year in the footer. And 56 sites show a year in the future, 2027 or later, which is one way to never look outdated.
- The longest redirect chain we followed took six hops: six addresses in a row, each saying “not here, try there”, before a page finally appeared.
Each of these records, and what it means for an ordinary website, is unpacked in the 13-minute homepage and other records from 293,806 websites.
What the Baltic web is for
Sort the living web by what each site is for, and the answer is the same in all three countries: the Baltic web is mostly businesses serving other businesses, with shops second. (We sorted sites by fixed rules where those are reliable and by a language model everywhere else; whenever the classifier was less than 0.7 confident, the site is reported as unclassified rather than guessed.) Professional and B2B services is the largest sector in every country: 8,598 sites in Latvia, 18,232 in Estonia, 18,863 in Lithuania. E-commerce is second everywhere (LV 6,888, EE 8,708, LT 13,600), ahead of hospitality and tourism (LV 3,199, EE 5,697, LT 6,228), the public sector including education and health (LV 2,999, EE 4,778, LT 6,302), media and publishing (LV 1,361, EE 1,346, LT 3,064) and finance, insurance and property (LV 1,042, EE 1,470, LT 1,825). In total, 28,637 of 38,539 eligible Latvian sites carry a sector label, 44,914 of 56,753 Estonian and 56,406 of 75,760 Lithuanian; the remainder, a quarter of live sites in Latvia and Lithuania and a fifth in Estonia, carry no label at all and are reported that way, honestly, as unclassified.
One note on how the shops were counted. A site only counts as a shop when two independent signals agree, because any single signal (a cart page, a shop platform, product markup) proved too easy to trigger by accident. And one honest caveat: when we had two different models sort the same sites, the line they disagreed on most was professional services versus “other”, so the sector mix is published with its accuracy check beside it rather than as a bare ranking.
Cross the sectors with declared AI policy and the pattern from earlier in the report sharpens into a single rule: media is the outlier in every country, and nobody else is close.
In robots.txt, 21% of Latvian media and publishing sites declare an AI block (278 of 1,325), against 9% in Estonia (117 of 1,337) and 11% in Lithuania (256 of 2,374). The next sector down in each country is far behind: in Latvia, “other” at 12% and finance at 10%, with e-commerce at 7%, public and hospitality at 5% and professional services at 4%; in Lithuania, finance and “other” at 7%, e-commerce at 5%, everything else at 3 to 4%; in Estonia, no non-media sector exceeds e-commerce’s 4%, and public bodies, hotels and professional firms sit at 1%. The one industry whose business model an answer engine directly threatens is the one industry that has written its objection down. Everyone else’s robots.txt is silent on the question, which is exactly what you would expect if they have never been asked it.
The same web, sector by sector
Cross the sector labels with the measurements and the sectors stop being a pie chart and start being a diagnosis. The clearest cut is speed. E-commerce is the slowest sector in every country: an average mobile performance score of 62.5 in Latvia, 63.2 in Estonia and 61.5 in Lithuania, and a “poor” main-content load time on 85.8%, 86.0% and 85.1% of its sites with a PageSpeed measurement (LV 5,789 of 6,746, EE 7,372 of 8,572, LT 11,341 of 13,334). A fast load sits under 4.2% everywhere. Hospitality and tourism is second worst (LV 64, EE 65.7, LT 63.5), and the fastest sectors are media and “other” at 71 to 73 in every country. Read that back: the sites that exist to sell something or to take a booking, where a slow page measurably costs money, are the slowest sites measured, and the ordering holds in all three countries at once.
E-commerce also takes the privacy chapter’s worst seat. Among rendered shops, 91.5% of Latvian (6,167 of 6,739), 91.1% of Estonian and 91.8% of Lithuanian set cookies before consent: the sector with the most direct commercial relationship to its visitors is the least likely to wait for their permission.
The email figures, cut by sector, are worth the whole sorting exercise. Actually protected against sender forgery: finance at 9.3% in Latvia (97 of 1,042), 12.4% in Estonia (183 of 1,470) and 4.9% in Lithuania (89 of 1,825); the public sector, education and health at LV 12.1% (362 of 3,001), EE 13.4% (640 of 4,778) and LT 3.9% (244 of 6,302); e-commerce at LV 7.1%, EE 9.6%, LT 2.7%; media at LV 3.5%, EE 6.0%, LT 1.6%. The plain consequence:
Roughly nine in ten Baltic finance domains, and nearly all media domains, can have their sender address forged.
The sectors whose names appear in the most phishing emails are barely better protected than everyone else.
The Estonia hypothesis, tested
The expectation everyone starts with, Estonia as the region’s digital leader, survives contact with the data, and the deep measurements sharpen it into something more specific than “fastest”.
The familiar column first: Estonia has the fastest median web, the most domestically hosted web, ten times Lithuania’s DNSSEC adoption, the fewest dead domains, the highest share of registered domains that become living sites, the fewest cookie-before-consent sites, the fewest frozen footers, and the least AI blocking: its web is the most readable by assistants. It even leads the vibe-coded table, with more Lovable sites than either larger neighbour.
The deeper column is the more interesting one.
Estonia is not just the fastest Baltic web; it is the most self-sufficient.
It hosts itself: Zone Media and Elkdata, two Estonian companies, serve 56.5% of its living web. It builds its own platforms: Voog serves 2,089 Estonian sites. It measures itself with its own instruments: Plausible, built in Estonia, runs on 4.3% of its web against a rounding error in both neighbours. Where Latvia’s web went abroad or disappeared behind Cloudflare, Estonia built a domestic stack and actually adopted it. Its one imperfection is almost endearing: Estonian homepages are the region’s thinnest at a median 278 words, and its web has the region’s highest missing-meta-description rate. The most efficient Baltic web is also the tersest, which anyone who has exchanged emails with an Estonian company may find unsurprising.
Latvia sits at the other end on most of the same measures: the slowest median load time, most dead domains, the smallest share of registrations that become living sites, most pre-consent cookies, highest AI-search blocking, no domestic host of scale, and a web that is either hosted abroad or hidden behind an American CDN. Its distinctions run the other way: the region’s most multilingual web, its best llms.txt adoption, and, via Cloudflare, its most modern connection technology. Lithuania is the region’s contradiction: the most aggressive stance against AI training crawlers, the region’s thickest e-commerce platform layer, the most mail-enabled domains, and 2% DNSSEC with the region’s weakest email protection.
The scoreboard
Twenty-four measurements, three countries, one table. The “leads” column names the country with the strongest showing on that row: most alive, fastest, most protected, most open to being read, most current.
Estonia leads sixteen of the twenty-four rows outright and shares a seventeenth with Lithuania. Latvia’s six are a specific kind of lead: the multilingual web, the AI-legible web (llms.txt, security.txt), the cleanest heading outlines and the least Google-dependent fonts, which is to say the best-annotated web sitting on the region’s weakest foundations. Lithuania’s one outright lead is the faintest of praise: its consent tools are ignored slightly less often than its neighbours’.
What we make of it
Three things stand out after reading almost 300,000 websites’ worth of data, and none of them is “the Baltic web is bad”.
First: the Baltic web is far smaller than it looks on paper, and nobody should quote registry numbers again. About a third of registered domains is a living website. The rest is parked, dead, forwarding somewhere else, or holding email. Any market sized on domain counts is roughly three times too big.
Second: almost nothing here was decided by the people who own the websites. The AI blocking mostly ships as a security product’s default. The llms.txt files are generated by plugins. The consent banners are installed and then ignored by the sites that installed them: nine in ten sites with a consent tool still set cookies before anyone clicks. DMARC gets adopted and then left in monitor mode, enforcing nothing. Again and again, the measured behaviour of a national web turns out to be the default settings of a handful of software vendors and hosts, not thousands of individual choices. Whoever writes the defaults writes the Baltic web.
Third: the machines quietly fixed their layer; the human layer is still waiting. The infrastructure that runs itself is in remarkable shape: free certificates everywhere, modern encryption on nine sites in ten, stable pages, clean automated scores. The things that need a person to care are where the region struggles: pages that take six seconds to appear on a phone, homepages with nothing written on them, email spoofing protection that exists but is switched off, shops that never tell search engines what they sell. The gap between the two layers is the most consistent finding in this study.
And underneath it all, three different countries. Estonia builds its own web, hosts it at home, and even measures it with its own tools; its lead in this study is real and it is structural, not a stereotype. Lithuania runs the region’s biggest commercial web on its own hosting giants and its own marketing tools, then signs 2% of its domains with DNSSEC. Latvia, with no hosting landlord of its own, put its web behind an American curtain, and at the same time built the region’s most multilingual, best-annotated sites. The three webs are as different as the three countries, and now, for the first time, the differences have numbers.
Most of what this report measures is fixable in an afternoon each: a DMARC policy, a meta description, a font served from your own server, a consent tool actually wired up, an image compressed. The Baltic web’s problems are not expensive. They are just invisible, and this report’s whole job was to make them visible. We will run the audit again and publish what changed.
Quoting this study in an article, a post or a slide? Everything below is prepared for exactly that: a ready description, the most quoted numbers, and images you can republish as they are.
About the study, in three sentences
The Baltic Web Audit is a Green Wire Media study that measured 293,806 websites, nearly every .lv, .ee and .lt domain linked anywhere on the public web, one by one, over July and August 2026. It covers speed, platforms, hosting, security, privacy and AI access, and every figure is a count, not an estimate from a sample. To our knowledge it is the first published measurement of the entire Baltic web.
Key numbers, ready to quote
- Three in ten Baltic domains are dead: 31% of .lv, 29% of .lt, 25% of .ee.
- The median Baltic homepage takes about six seconds to show its main content on a phone.
- Up to 18% of websites block AI training crawlers at the server, most of it by vendor default, not by choice.
- Only 3 to 9% of live domains are actually protected against email sender forgery.
- One company serves 41.7% of the living Estonian web; a different company serves 41.7% of the Lithuanian one.
- Nine in ten sites that installed a cookie-consent tool still set cookies before consent.
- WordPress runs on 83,874 Baltic websites, first in all three countries.
Images, free to republish
Six stat cards, 1200 by 630 pixels, sized for articles and social posts. Latvian versions are on the Latvian edition of this page.
How to credit us
The text, numbers and images here are free to republish. We ask one thing in return: link to this report as the source. A working credit line: "Source: The Baltic Web Audit, Green Wire Media, August 2026" with a link to this page. For interviews, custom data cuts for your market, or checks of a specific figure, write to info@greenwiremedia.com.
Method, in brief
The domain list is every .lv, .ee and .lt domain in four releases of Common Crawl’s public index; 293,806 of them were crawled over July and August 2026, all from one fixed server in Helsinki (with a separate control run from a second location), every request carrying an honest identifier. We never disguised the crawler, because being blocked is itself one of the measurements. For each domain we checked its DNS records, its certificate and secure connection, its server’s responses, its robots.txt and the other standard files sites publish at fixed addresses (each tested against the false-“found” servers described in the llms.txt chapter), made a full browser visit, and ran Google’s PageSpeed test: mobile for 85 to 91% of live sites at time of writing, desktop for a smaller set measured both ways so the scores can be compared. Registry totals come from the registries themselves: the .lt registry’s chart data export, the .ee registry’s published figures and milestone announcement, and NIC.LV’s published statistics chart, which offers a chart rather than a number and is quoted as “roughly” for that reason. Technology and plugin figures come from a fingerprint ruleset run over the stored copy of every page; the deep-dive detections (certificates, hosting networks, server headers, nameservers, analytics, on-page basics, languages, freshness) are re-readings of the same stored responses, and every detection count is a minimum: a fingerprint that does not fire is not proof of absence. Sector labels come from fixed rules where those are reliable and from a language model everywhere else; anything the classifier was less than 0.7 confident about is reported as unclassified. We checked the labels two ways: against sites whose sector is known from hard evidence, and by having a second, independent model sort 2,000 of the same sites (the two agreed 87.3% of the time, and their commonest disagreement was professional services versus “other”). Aggregates only: no individual site is named beside a weakness. Raw responses are retained, so every future metric is a re-reading of this run, not a new crawl.
We ran the same measurements on our own site. greenwiremedia.com serves HTTPS only, with TLS 1.3, enforces DMARC, publishes a security.txt and a genuine llms.txt, sets no cookie before consent, and puts its main content on screen in about 1.4 seconds in the same throttled mobile test that puts the regional median near six.
Green Wire Media (2026). The Baltic Web Audit: a machine-measured study of the Latvian, Estonian and Lithuanian web. https://greenwiremedia.com/baltic-website-audit/