A wholesale distributor with sales agents and delivery trucks on the road every working day asked us two things: what actually happens out there, and could the routes be better. Anonymised at the client’s request. The screens below run on generated demo data, so no shop, agent or vehicle in them is real.
What they already had
Every vehicle carried a Mapon tracker, and Mapon does its job: where each car is, where it has been, how far it drove. It is a fleet tool, though, and the questions were sales questions. There was no single overview of the whole territory. There were no filters for the things the business cares about, such as which stops were clients and which shops along a road are not clients yet. And nothing looked at a recorded day and said whether the same stops in a different order would have been a shorter drive.
So the data existed, and nobody could read it.
What we built
One closed web system that pulls the recorded trips from the Mapon API, joins them to the client list, and draws all of it on OpenStreetMap.
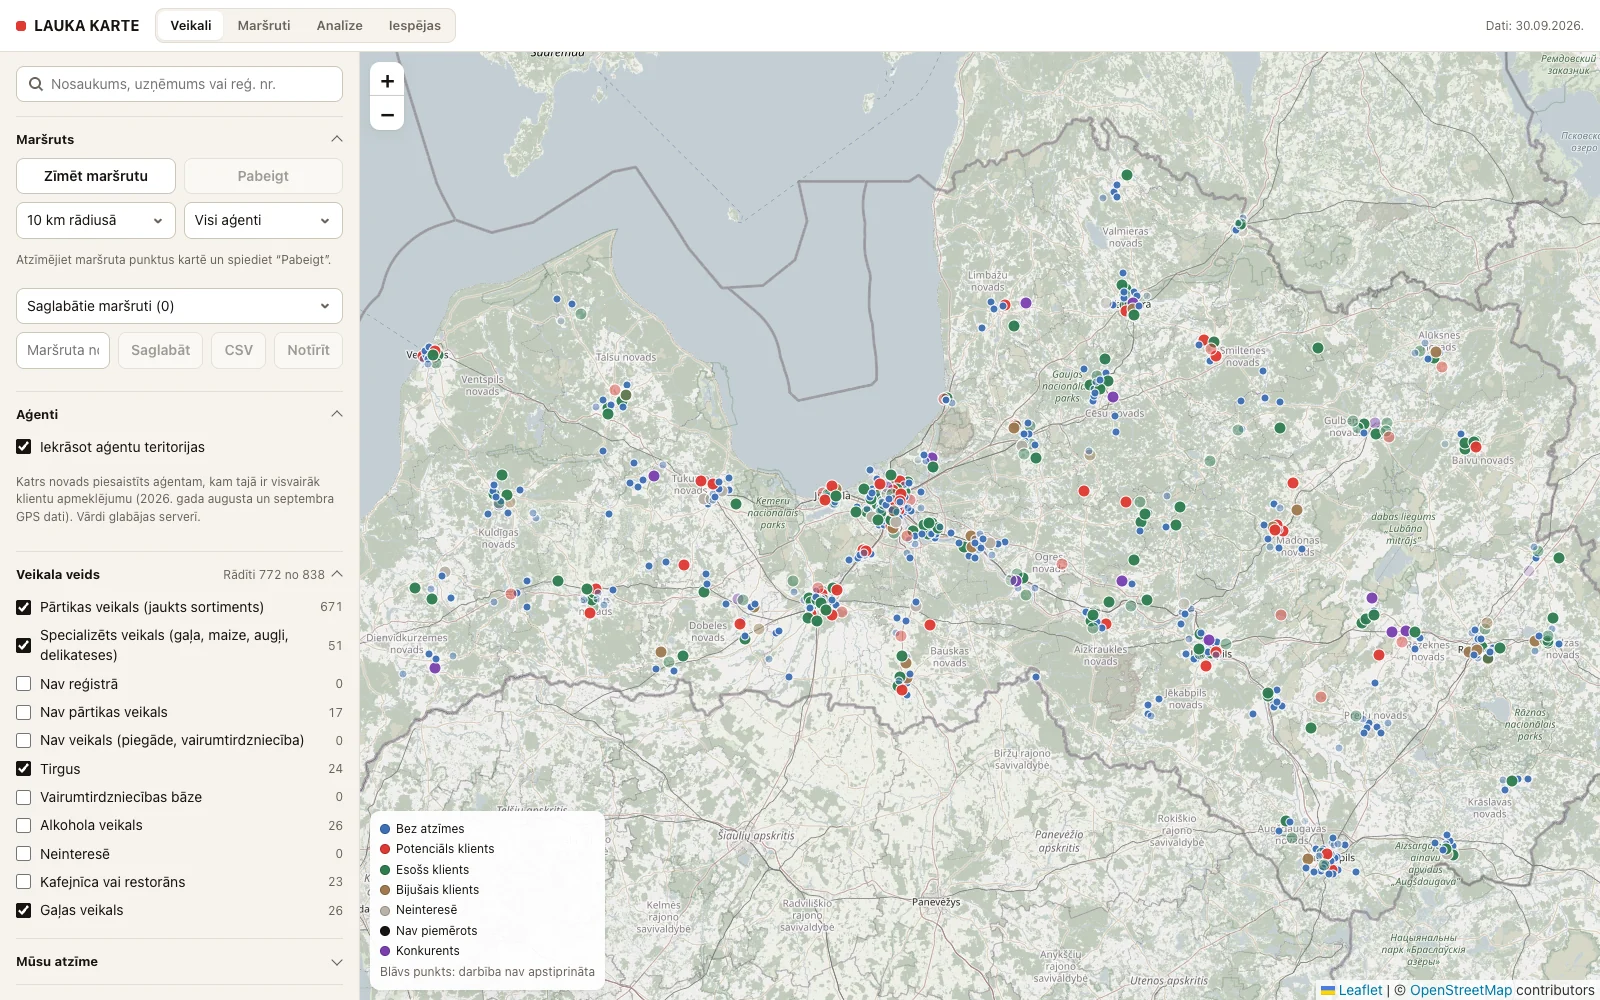
One map of the whole market. Every shop that could be a customer, not only the ones that already are. Each point is coloured by where it stands: existing client, potential client, former client, not a fit, competitor. Behind each point is the company that runs it, with its turnover and tax rating from the public registers, and whether the shop is still open. The team marks shops themselves and the marks stay when the data is refreshed.
Filters that match the questions. Shop type, status, agent territory, our own marks, each with a count beside it. “Show me the independent grocery shops in this agent’s area that we do not supply” is three ticks.
Shops along a route. Draw a road on the map, or open a recorded one, and the system lists every shop within 5 or 10 km in driving order, with the distance from the route. That list is the agent’s prospecting plan for a day they are driving anyway.
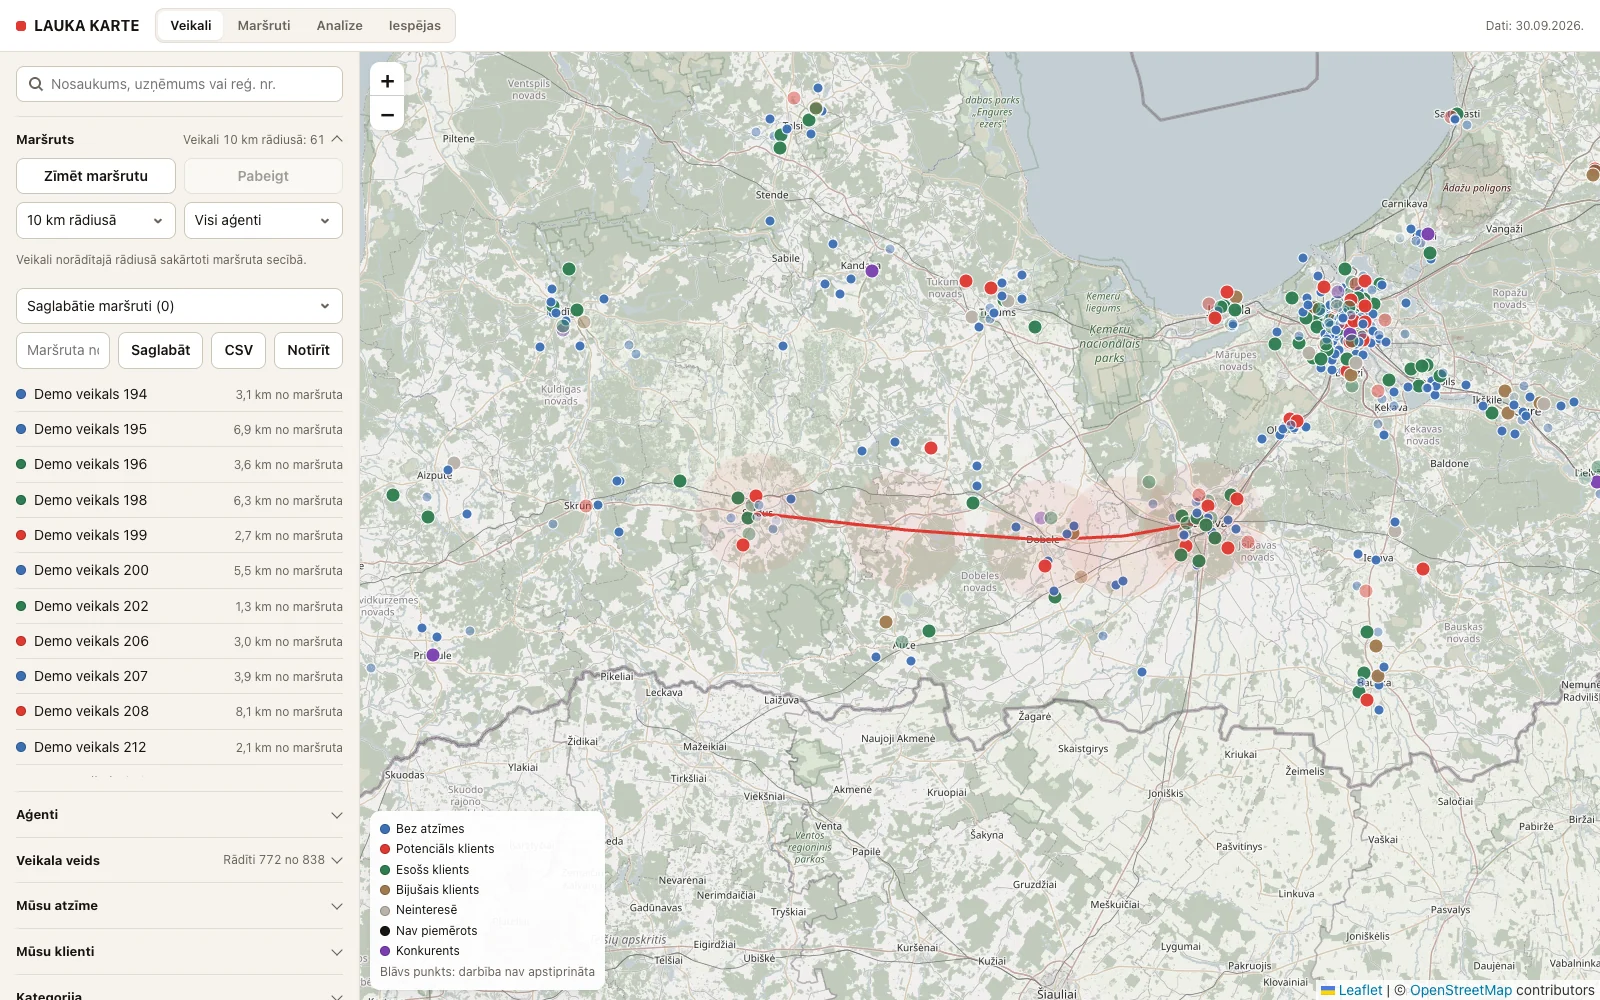
Recorded days, readable. A day’s trips become a line with stops: which were clients, how long each took, what the visit cost in kilometres and time once the client’s own rates are entered.
Suggestions for a better order. For any recorded day the system works out whether the same stops could have been driven in a shorter order on real roads, and shows only the stretches that change, each with the kilometres and minutes it saves. A suggestion that saves under two minutes is dropped, and so is one that sends a truck down a gravel road. Stops that cannot move, such as the depot, fuel and pickups, stay where they were. It advises. The agent who knows the shopkeeper decides.
What a shop is worth and what it costs
The map shows where things are. The other half of the system puts money on it, by joining the client’s order export to the same shops.
Every shop has a cost to serve. For each agent visit and each truck delivery the system measures the detour: how much further the vehicle drove than it would have going straight from the stop before to the stop after. A shop on the road costs only the minutes spent in it. A shop well off the road costs the drive as well. Kilometres are priced from the fuel each vehicle actually burns, as the tracker reports it, and time at the hourly rates the client enters. The result is one figure a month per shop, with a plain breakdown of how it adds up: how many visits and deliveries, how far off the route, how long at the door.
Orders against cost. Beside the cost sits what the shop orders a month, the orders it would need to cover its cost at the client’s margin, and what is left after serving it. A shop that costs more than it earns is flagged. Where a weekly visit could be fortnightly, the system says so, because that halves the agent’s share of the cost without dropping the shop.
The order value that makes a new shop worth it. Every shop nobody supplies yet is priced as if it were added to the cheapest weekday an agent already drives there and the cheapest truck run. Out comes the monthly cost and the orders needed to cover it, also shown as a share of the shop’s own turnover. That number is the sales brief: this shop is worth a stop if it orders about this much. The list is sorted by how small that ask is.
The bar drops as the neighbourhood is won. A shop’s panel shows what is around it: the shops already served within 3 km and what they order together, the other prospects nearby, and how close the trucks and agents already come. Because the cost is the detour and not an average, every client won nearby pulls the route closer, and the orders the next shop needs fall with it.
Agents and trucks in the same terms. Per agent: visits and kilometres a day, the share of visits followed by a delivery within three working days, the monthly cost of shop visits, and the margin left per shop and per visit. Per truck: runs, drops per run, departure and return times, measured fuel consumption and the cost per drop. Any period, down to a single day, can be compared with the one before it.
Clients going quiet. The system learns each client’s delivery rhythm from the trucks. When a shop that took a delivery every two weeks skips two cycles, it is on a list that week. Shops an agent keeps visiting that never take a delivery are listed too, and so are the regular visits an agent missed.
What it showed
The first result was not the one anyone expected: the drivers were already close to the best order. Reordering stops was worth about one per cent of the driving. That is useful to know before spending a year optimising routes. The money is in other questions, which the same system now answers: how often each shop really needs a visit, and which visits cost more than they bring in.
Closed by design
Agent locations and a client list are about as sensitive as business data gets. The system is not public. Only named people at the company can open it, and we tested it from the outside the way a stranger would before anyone received a login. We also built it without browsing the real data: every screen was developed and checked on generated records, the same way these screenshots were made.
Built on the Mapon API and OpenStreetMap.